

In March, we focused on improving the user experience (UI) of some of our existing features, such as the exporting page and the metering page. We’ve also introduced a new maintenance page and a tab navigation in the benchmark page. Based on customer feedback and usage analysis, we identified a few areas that could use a bit of tweaking.
Improvements to existing features
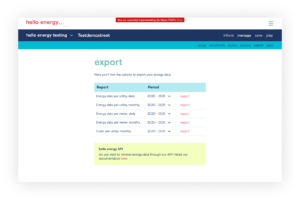
- Exporting reports
Our previous reporting page enabled you to create exports of your data and connect to our API. Because of the way the UI was presented, users found it harder to recognize the previous year. That is why we changed the way the page looks.
- Metering page
The page where you can find your meters is a bit more technical. We updated the table so that the meters are presented in a way that is easier to read. We also added the metering status indicator. This indicates whether the metering is passing on data to the system or it’s having troubles sending data.
What else is new?
- Updated navigation buttons on the consumption graph
We analyzed that the navigation buttons on the consumption graph where not always easy to locate for all our users. That is why we updated them to make them more visible. Navigating to a previous or next period withing the graph is now a little easier.
- New presentation of buildings and sub buildings in the navigation
Buildings with a lot of tenants and submetering, all get their own part on the hello energy tool. However, locating all the sub buildings in the navigation can be a hard task. Especially for our portfolio clients! We changed the building navigation so that it shows the main building and all the connected sub buildings in one group. This makes it a lot easier to find the correct location.
- New look and feel of the benchmark page
The benchmark page tells you how you are comparing against a market benchmark. But what if you wanted to compare against another building, or if you wanted to see the Paris Proof benchmark? The current design does not leave enough room for these kinds of additions. That’s why we decided to change the design of the graphs a bit. With this change we are setting the first step towards extending the functionality of the benchmark page.
New features
- Tab navigation in benchmark page
The benchmark page graphs not only got a first design change, we also introduced a tab navigation to reduce page cluttering and to give a clear vision of the benchmark. - New maintenance page
In preparation of our regular release schedule, we created a new maintenance page. This page will be shown temporarily when an update takes place.
What else is new?
- Building navigation
Switching between buildings has become easier. Prior to the update, using the navigation to switch to a new building resulted in navigating to the homepage again. After the update, switching to another building will result in a refresh of the page that you are currently visiting but with the data or information of the selected building.
- Fixed
Wrong email link after completing sustainability radar. The email that was sent after completing a sustainability radar survey, contained a wrong link. We changed that to the correct link.
- Changing profile information resulting in error.
Sometimes, adding additional profile information resulted in a saving conflict. This has been fixed.
When will all these awesome changes become available? We will first release this update to our first release customers. The update becomes available for everyone at the end of April.