

After selecting a building, you can navigate to our manage insights.
Under usage, you find our fancy graphs about all your energy data, sorted by the utility.
In this view, the data are accumulated on what we call utility level. All data from meters of the same utility are summarized to create this overview.
You can easily switch between annual, monthly, weekly, or even daily views. Using the arrows navigation left (<) and right (>) you can move in time.
Compare your performance to the market with a new benchmark feature
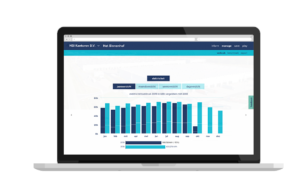
Again under the manage tab, you will find your building’s benchmark.
Here is presented the deviation (+ or -) from the industry average, when there is an industry benchmark available. The values are calculated per utility per m2.
In case you have more than one building in your portfolio, you could also rank all of them using my portfolio option that you will find after you click the hamburger icon (top right).
Other updates
- data on meter level
Enriching the manage tab with connections we have now built detailed insights, providing graphs on deeper information and presenting data of each meter separately.
For each of your meters, you can see any relevant measurements, such as consumption, delivery, return delivery, and production, per day, per 4 weeks, or per month. All the historical data from the beginning of last year are available. - sensor data
Sensors are again to be found under manage. Data appear on the sensor level and are grouped in clusters based on the type of measurements (for example, indoor climate sensors, outdoor climate, etc). You see in real-time what the latest values are. These data are also available for the last 4 days or the last week. - connected apps
When in manage, go to apps and redirect to one of our partners’ portals, so you have quick access to their online platforms, if applicable. Contact us to connect you with the data providers. - export
Our API has improved, making it easier to collect all your data within a few steps. For more details refer to our documentation, after login in with an account with administrative rights.